
Longread
Variation in postharvest water loss between fruits picked from one tree
The information in this article is a result of the research project HUMISTATUS (www.wur.nl/humistatus). This project has the goal to deliver top quality pears by gaining more insight in their water status. A better understanding of the variation between individual pears in postharvest behavior will contribute to this goal. Therefore, one of the trials was the comparison of 140 pears originating from one tree, meaning pears with corresponding growth conditions and weather. The water loss and other postharvest quality characteristics were followed for each individual pear during storage. The results on water loss are described in this article.
Relevance to practice
Water loss (moisture loss) of fruits during storage can causes quality losses such as shriveling and loss of fresh appearance. It also means loss of saleable weight. There is variation in water loss between batches of fruit, also when stored in the same room. And there is variation within the batch, even between fruits from the same tree. When knowing which fruits are more susceptible to (too much) water loss, one can anticipate with practical measures in the storage rooms.
Measurements at harvest
All 140 pears on a Conference pear tree were labelled with an unique number just before harvest. For every pear the position on the tree was measured. This was expressed in XYZ coordinates with the base of the trunk as basis.
Pears that were part of a cluster had the same coordinates. Photos were taken of each pear to capture details for later reference. The fruits were then carefully picked and weighed.

Measurements after storage
The pears were packed in one layer trays inside plastic crates and stored during 5 months in Regular Air (RA) at -0.5 °C. At the end of this storage period the pears were weighed again. The weight loss over the storage period can be considered as a good estimation of water loss. The applied RA storage period was long but deliberately chosen to enlarge changes between individual pears. Indeed, after 5 months, individual fruit weight loss varied from 3.3% to a very high loss of 9.9%.
Other assessments at the end of storage included fruit length and diameter, background color, firmness and % russet of the skin. The russet brown marks are a normal feature of the Conference pears, though the coverage differs between lots and between individual pears.

Relationships between weight loss and other variables
Regression analysis was used as statistical method to examine relationships between the % weight loss and other measured variables. This lead to very useful results: It indicated a strong relationship between weight loss and fruit weight, and between weight loss and % russet. Lower fruit weight (smaller fruit size) and higher % russet showed more weight loss.
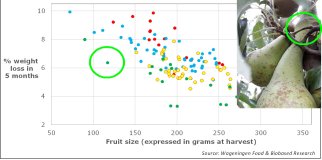
This is visualized in the next figure. It shows the % weight loss over 5 months RA storage (y-axis) against fruit weight at harvest (x-axis). The 140 dots represent 140 pears. The different dot colors represent different russeting classes of the pear surface, ranging from less than 20% of the pear surface (green dots) to more than 60% (red dots) .
It can be seen that the smaller pears (left part of the figure) generally had lost more weight than bigger pears (right part of the figure). Also pears with a high % russet (red dots) generally had lost more weight than pears with a low % russet (green dots).

Deviations
Some pears had a weight loss which deviated from what could be expected based on external characteristics. Tracing back to the original position on the tree proved very valuable here. For example, an abnormal low weight loss was found for the cluster of 2 pears originating from a short fruit spur directly on the trunk. An abnormal low weight loss was also found for a pear that had the natural breaking point of its stalk attached to the stalk of another pear, which is unusual.

Conclusion
In this research we deliberately created a large range in water loss, from 3.3% till 9.9%. Such a high water loss will hardly be found in practice, but nevertheless this research provided relevant insights. The effect of fruit size may be well known, the effect of russet is less known. The findings support decisions for practical measures. Batches with pears of big sizes and relatively smooth skin (low % russet) are less susceptible to water loss than batches with small sizes and russetted skin. In the latter situation, the pears deserve extra attention in long storage with practical measures to limit water loss such as optimal use of the cooling capacity, cleverly controlling the refrigeration, or active humidification. Postharvest consultants of Wageningen Food & Biobased Research can help you further in optimizing storage.
Reference
More information about our research on moisture status of fruit can be found at www.wur.nl/humistatus and in: Brouwer, B., van de Geijn, F., Verschoor, J., Wissink, E., & Hogeveen, E. (2020). Humistatus peer: Eindrapportage Werkgroep Peer. (Rapport / Wageningen Food & Biobased Research; No. 2097). Wageningen Food & Biobased Research. https://doi.org/10.18174/537206